Lifetimely: Predictive LTV: How It Works
At a glance: Predictive LTV in the Lifetime Value Report uses machine learning to project future customer value based on current buying behavior. This guide walks you through how to access, understand, and apply predictive data to forecast revenue and anticipate long-term customer value.
Related: For a walkthrough of standard Lifetime Value Report features, see our LTV Report Walkthrough article.
Why this report matters
Predictive LTV adds a forward-looking layer to your Lifetime Value analysis. Instead of waiting months to see how new customers behave, you can project their future value right away and plan accordingly. This makes it a powerful tool for both marketing and retention strategy.
Predictive LTV allows you to:
- Forecast revenue earlier - anticipate future customer value before full historical data is available.
- Guide strategy with foresight - refine acquisition and retention plans using forward-looking projections.
- See the whole picture - combine predictive insights with historical performance for a complete view of your customer base.
How the predictive LTV model works
The predictive model uses machine learning to forecast how much value your customers will generate in the future.
Here’s how it works step by step:
- Analyze behavior: The model reviews historical purchase patterns such as products bought, reorder frequency, and spending habits.
- Find matches: It compares current customers with past customers who had similar behavior.
- Project outcomes: Using these matches, the model predicts both:
- How much each customer is likely to spend in the future
- When those purchases are most likely to occur
- Aggregate to cohorts: All individual projections are rolled up to the cohort level, giving you a monthly forecast of accumulated sales over time.
How to access your predictive LTV data
- Navigate to Lifetime Value > Cohorts from the side menu.
- Just below the report settings, toggle on Predictive data.
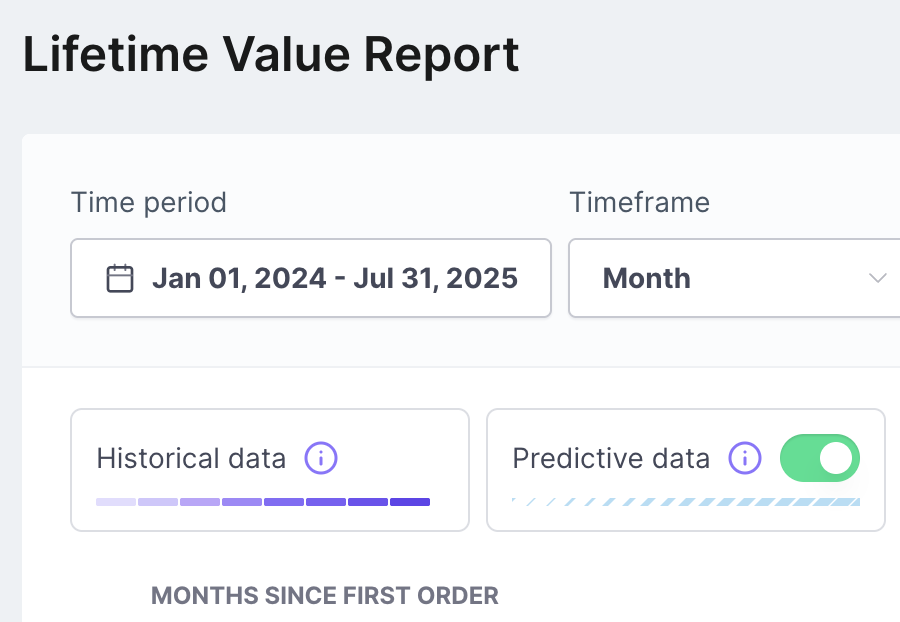
Colour Guide:
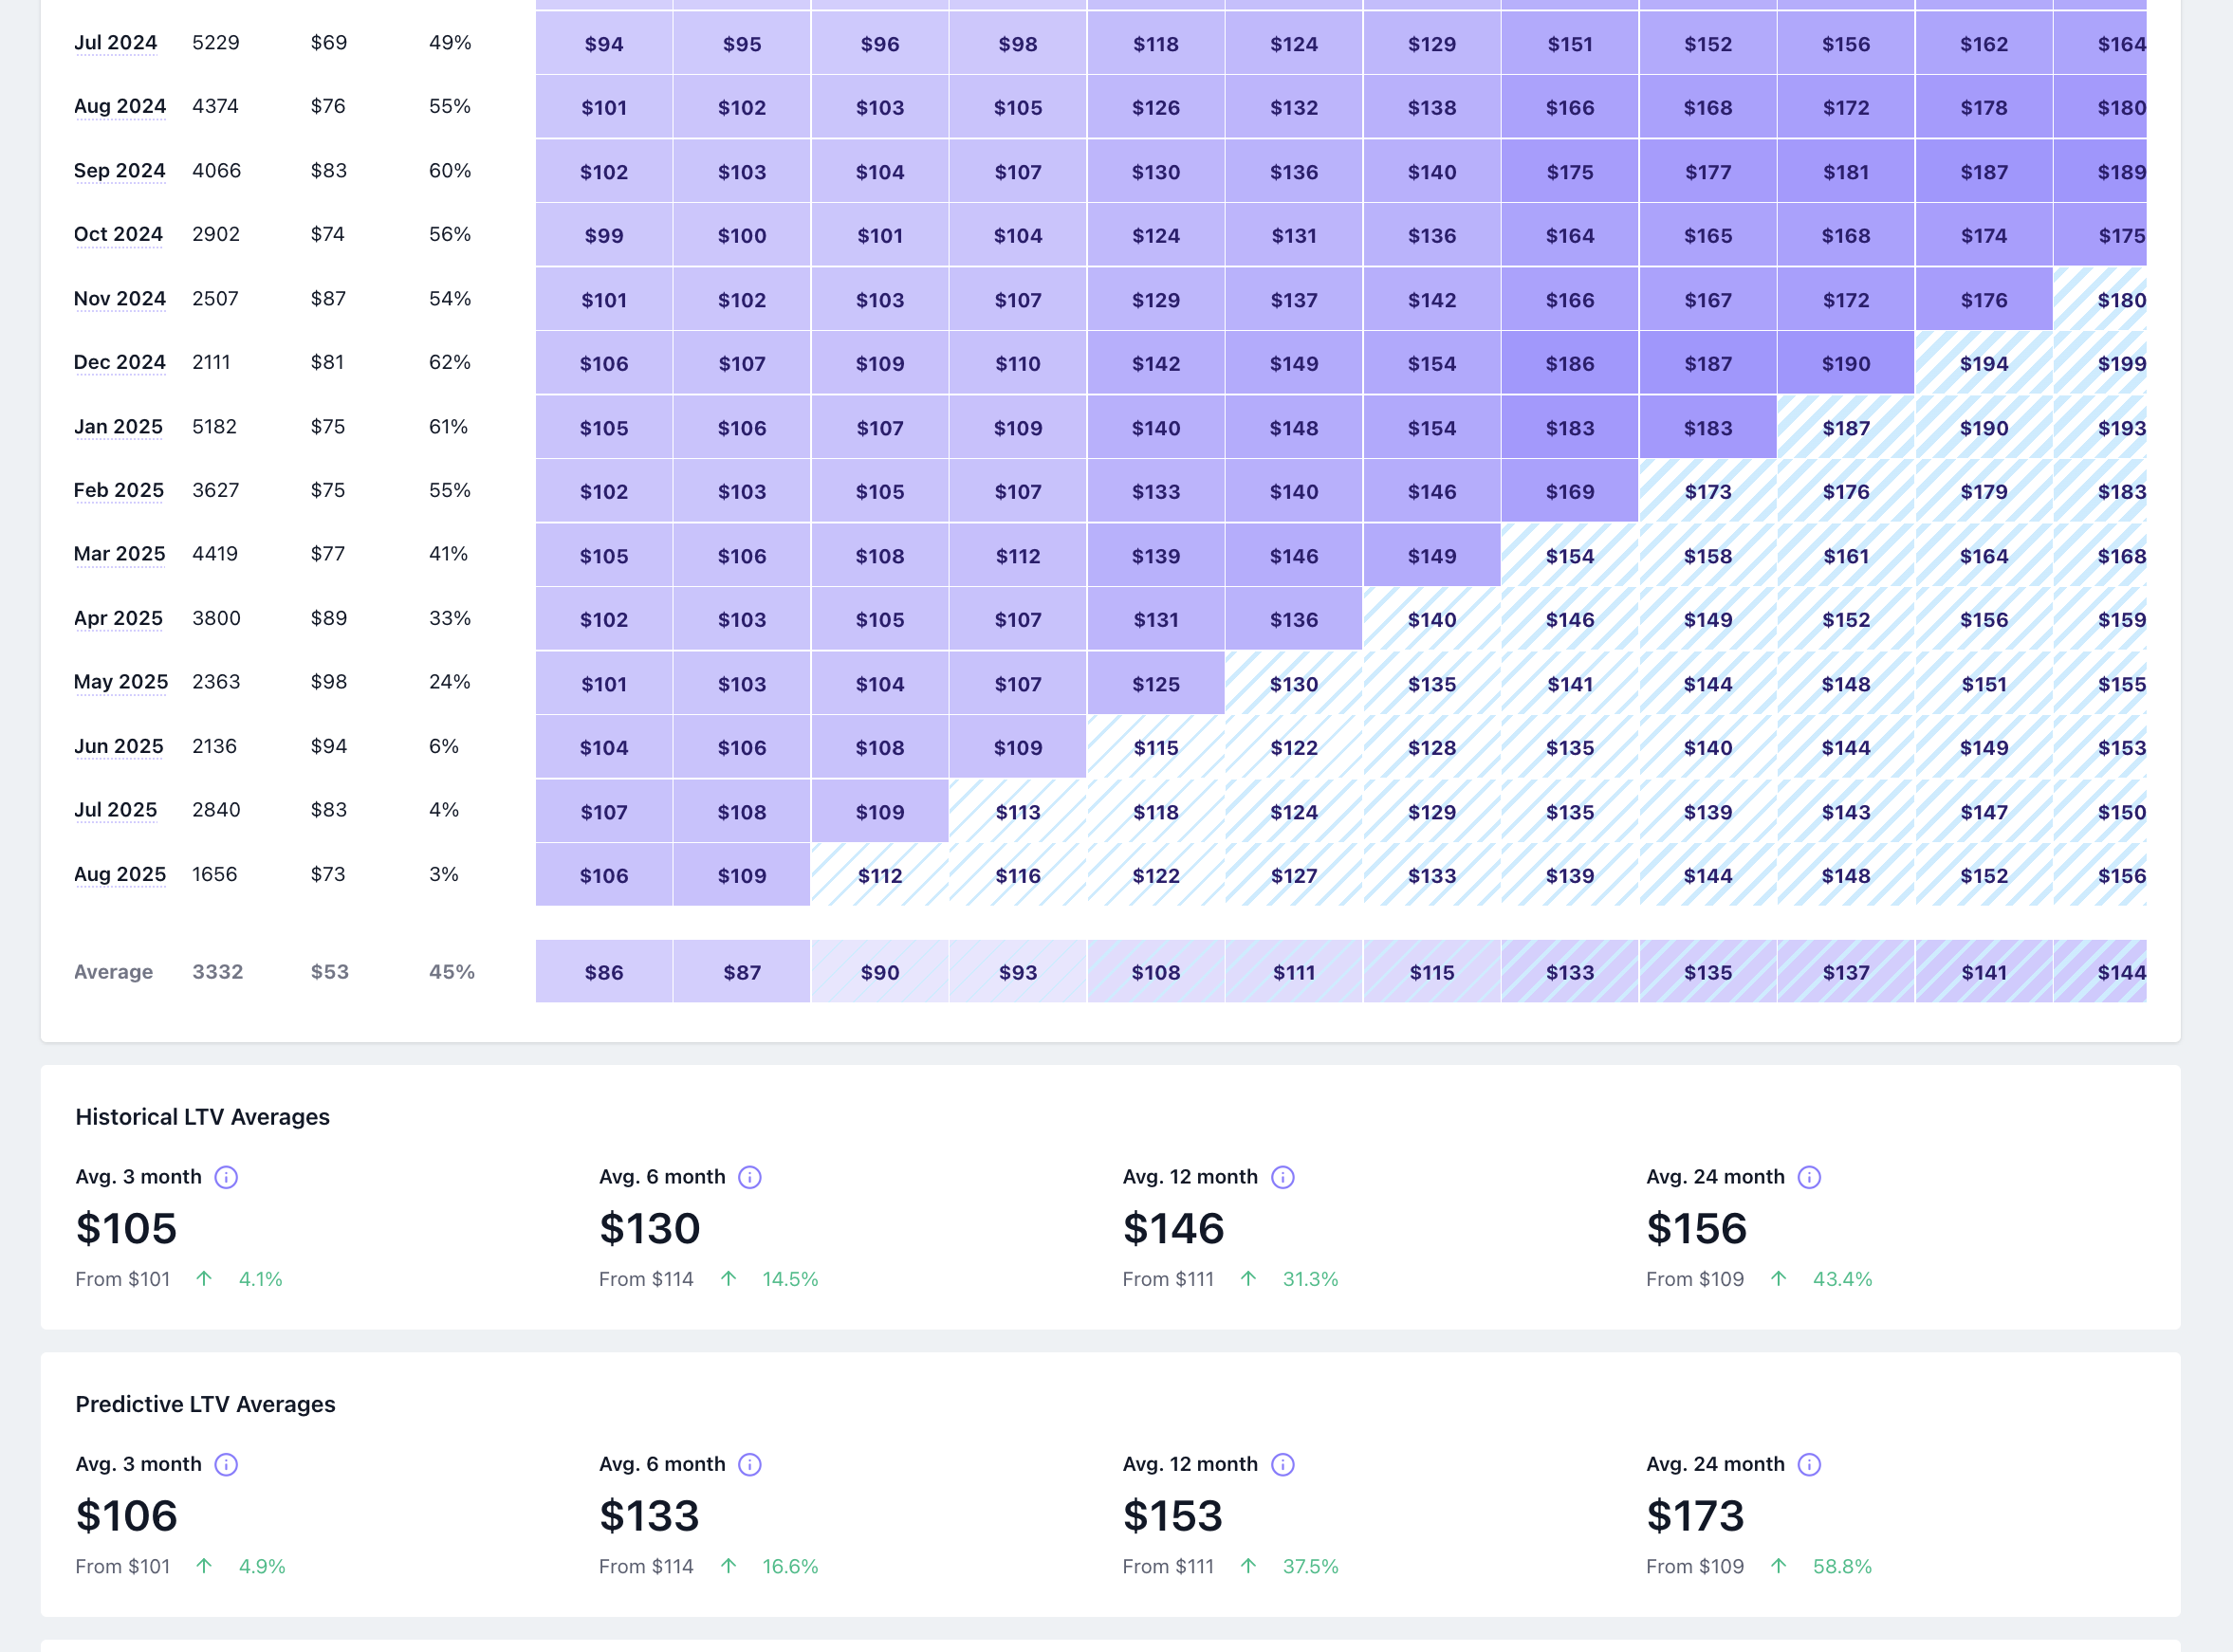
- Historical data = solid purple (top-left of matrix)
- Predictive data = striped light blue (bottom-right of matrix)
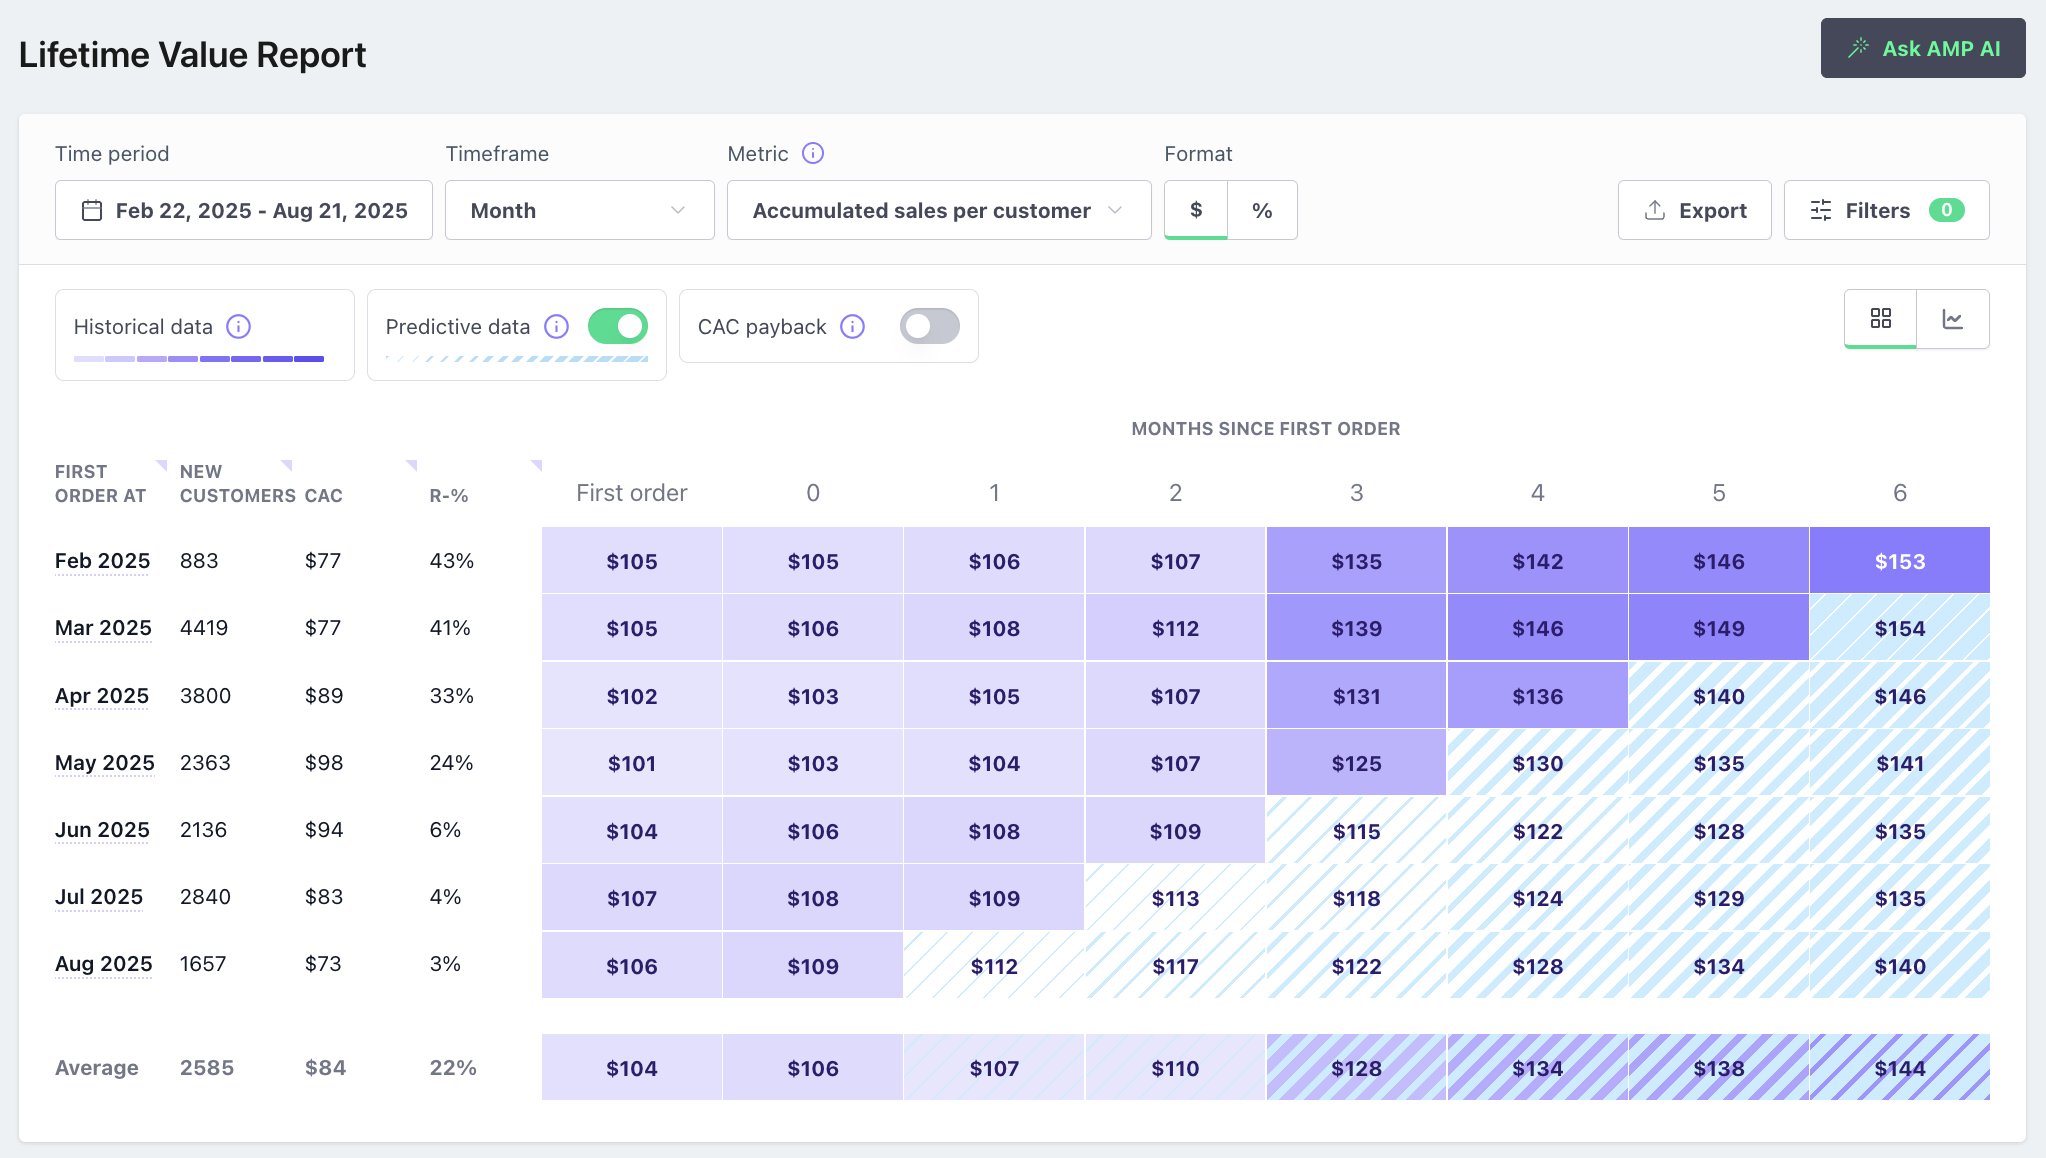
What your projections are telling you
Predictive data fills the “white space,” extending accumulated sales beyond available history.
- Historical data: Solid purple cells (top-left) = actuals
- Predictive data: Striped blue cells (bottom-right) = projections
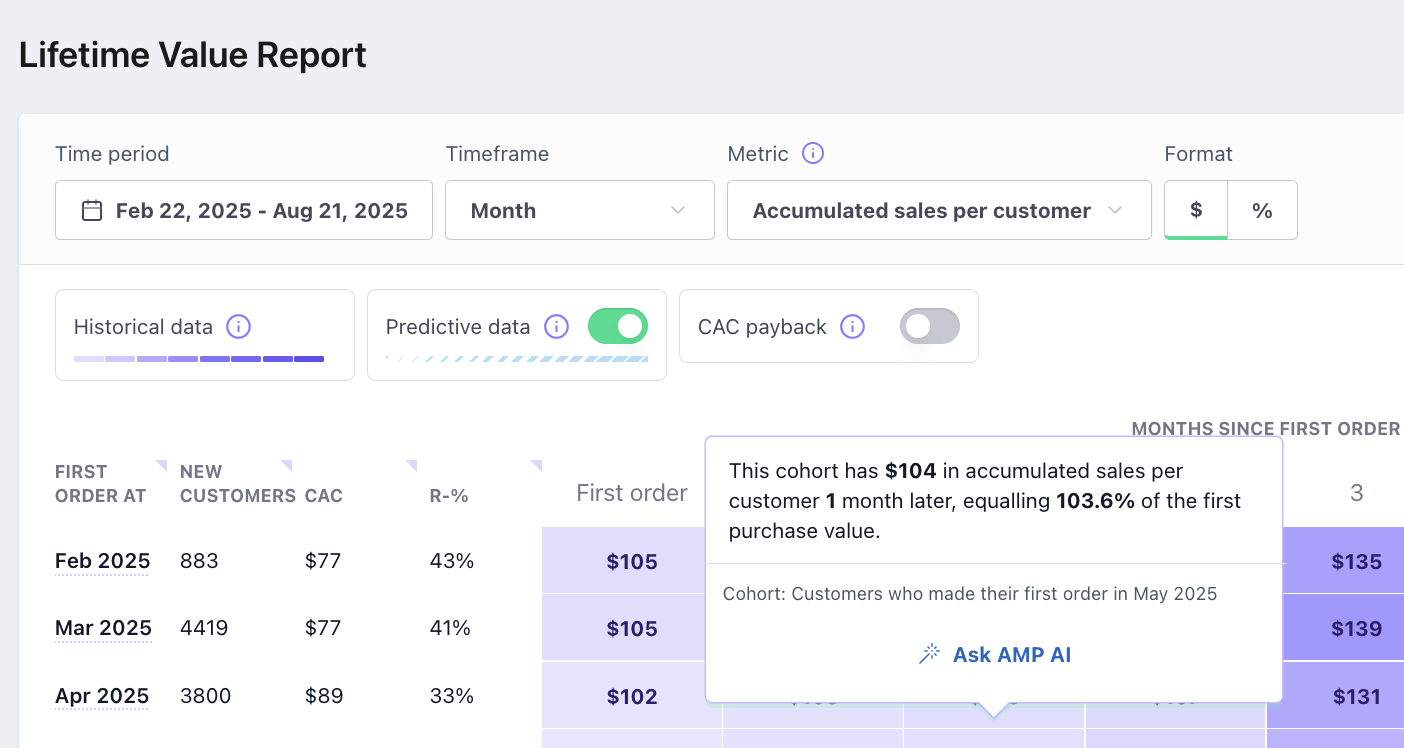
Example - May 2025 cohort
- Months 0–3: historical values (e.g., $101 → $125 by month 3)
- Months 4–6: predictive values (e.g., $130 → $141)
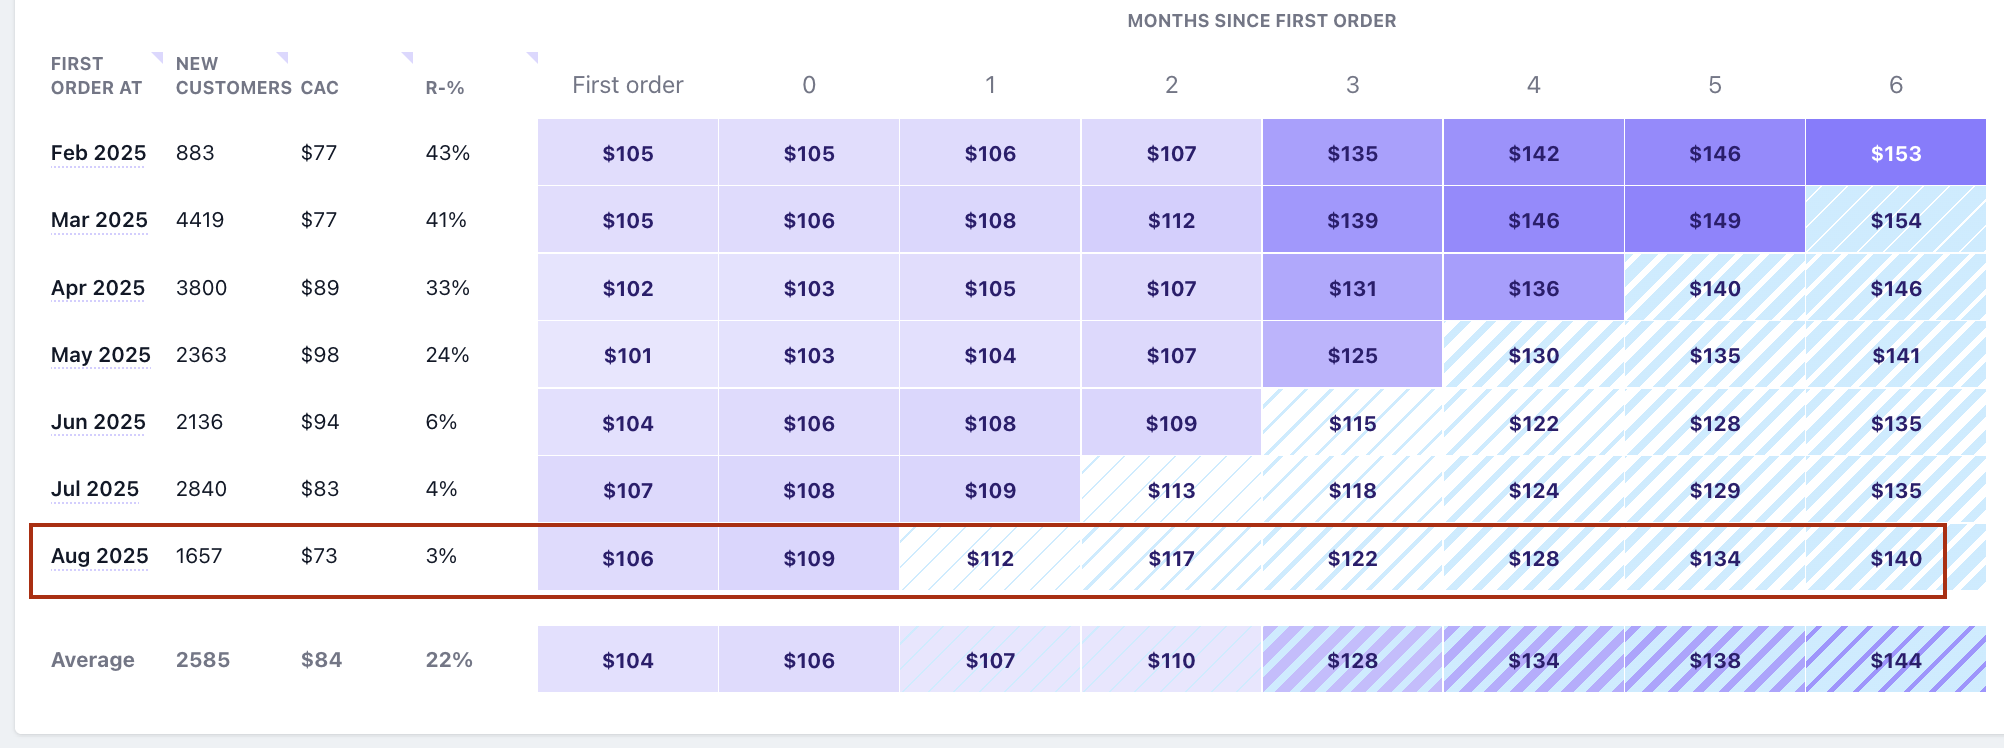
Example - August 2025 cohort
- Month 1: Predictive → $112 (end of Sep 2025)
- Month 6: Predictive → $140 (by Feb 2026)
- Projections extend beyond reporting window → forward-looking customer value
Customize the view
Time period
- The model projects up to 24 months.
- To unlock longer projections, extend your report’s date range further back.
- Think of predictive data as filling the white space - the longer your lookback, the more future months can be projected.
Example:
- Mar 1–Aug 31, 2024 → projects 6 months out.
- Aug 1, 2023–Aug 31, 2024 → projects 12 months out.
Timeframe
- Organize cohorts by week, month, quarter, or year. Projections adjust automatically.
Filters
- All standard filters apply - you can analyze predictive projections for any segment (e.g., by channel, product).
Metrics (currently supported)
- Accumulated Sales per Customer
- Accumulated Gross Margin per Customer
- Cohort Sales
- Accumulated Sales per Customer / CAC
- Accumulated Gross Margin per Customer / CAC
Note: Not all metrics currently integrate with predictive data. Additional metrics are being rolled out over time.
Read the chart
The report includes two additional sections below the matrix that use predictive data:
- LTV Averages
- Shows average accumulated sales at 3, 6, 12, and 24 months
- Combines historical and predictive data for an aggregate view
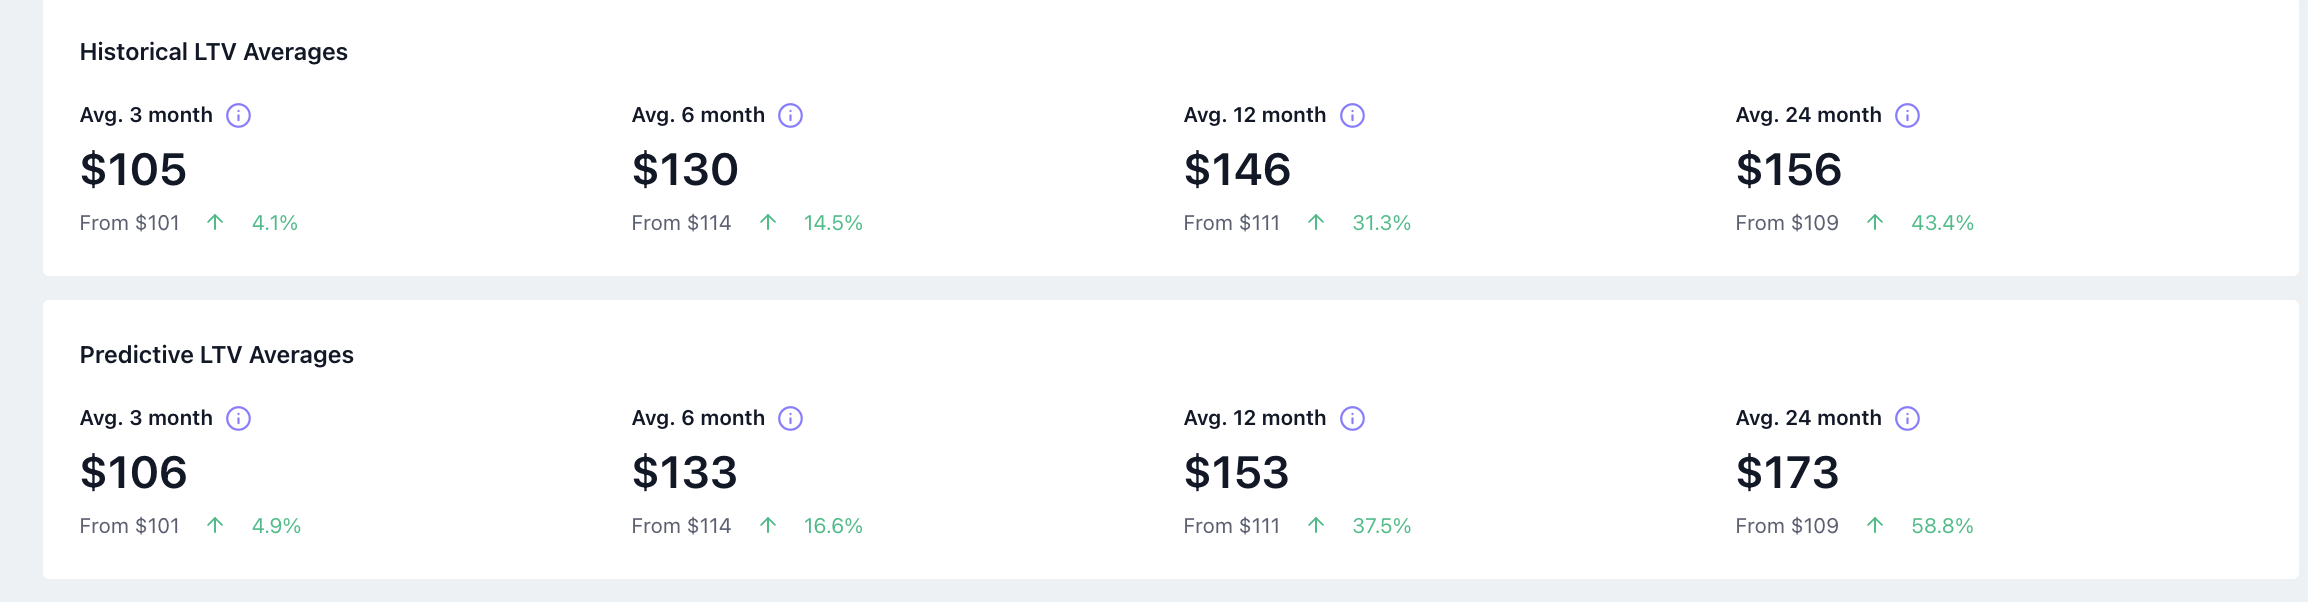
Predictive vs Historical LTV
-
Predictive LTV: Estimates a customer’s future value. Best for forecasting revenue and planning long-term strategy.
Historical LTV: Calculates a customer’s actual value from past purchases. Best for analyzing performance and comparing cohorts.
💡 Tip: Use both together for the clearest picture of your customers’ value over time.