Lifetimely: LTV Cohort Report Overview
At a glance: The Lifetime Value (LTV) Report groups your customers into cohorts based on their first purchase date, allowing you to track how their value grows over time and see which groups are most profitable.
Related: For a full guide to using predictive data, see our Predictive LTV Walkthrough.
Why this report matters
The LTV Report is essential for understanding the long-term value of your customers. It helps you:
- Measure how much revenue each group of customers delivers over time.
- Identify which cohorts deliver the highest repeat revenue.
- Track CAC payback and know when acquisition costs are recovered.
- Decide where to invest your marketing budget to acquire the most valuable customers.
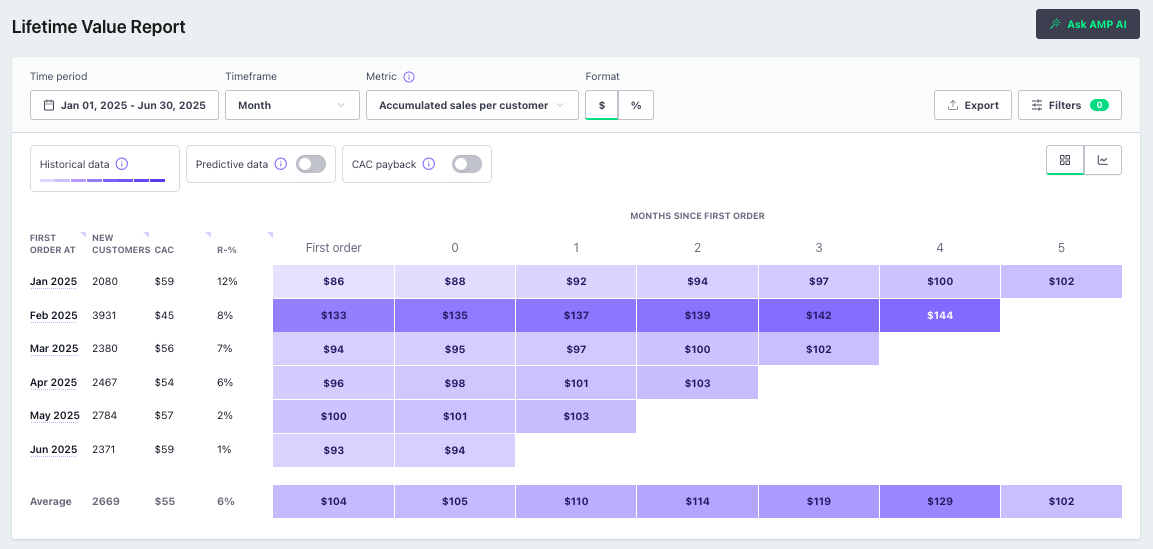
How the report is structured
The report is a matrix where each row represents a cohort - customers who made their first purchase in the same week, month, quarter, or year.
| Left columns (Cohort summary) | Right columns (Value over time) |
|---|---|
| New customers: Number of new buyers in the cohort | First Order (0 months): Average spend on their first order |
| CAC: Average spend to acquire each customer | Accumulated Value Growth: How customer value increases as they repurchase |
| R-% (Repeat Rate): Percentage of customers who placed at least one more order | Final column: Total per-customer value at the end of the timeframe |
Customize the view
Time period & timeframe
- Analyze up to 4 years of data.
- Group cohorts by week, month, quarter, or year depending on how granular you want your analysis.
- Use shorter timeframes to measure the early impact of recent campaigns.
- Use longer timeframes to track customer value and retention trends over the long run.
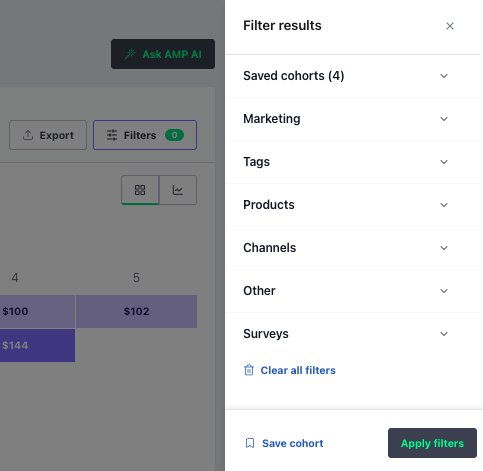
Metrics and filters
- Metrics: Default is Accumulated Sales per Customer. Other options include Gross Margin, Net Sales, Orders, Contribution Margin, and more.
- Filters: Focus your analysis by filtering cohorts by Marketing, Tags, Products, Channels and more.
- Saved cohorts: Save commonly used filter combinations for quick access in the future.
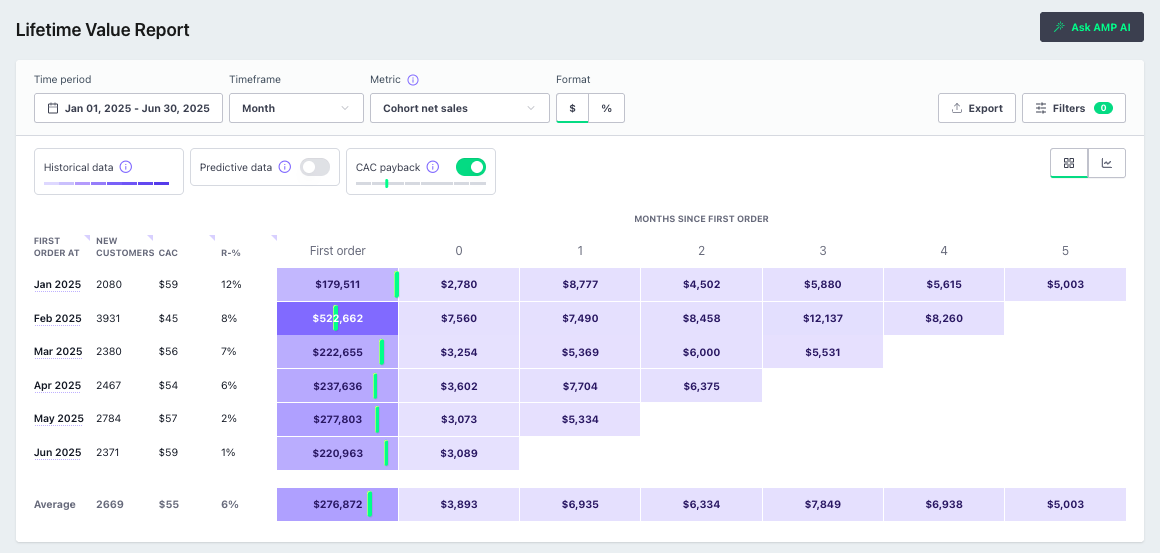
CAC Payback tool
- What it shows: The CAC payback feature visually indicates when each cohort becomes profitable.
- How it works: A green vertical line appears on the timeline when a cohort’s gross margin (sales margin) exceeds its Customer Acquisition Cost (CAC). This marks the break-even point.
- Why it matters: Understanding when cohorts pay back their acquisition cost helps you make informed decisions on marketing ROI and scaling strategies.
💡Tip: Connect all your marketing channels for the most accurate CAC calculations.
AI insights
The Ask AMP AI button in the report header provides instant, data-informed answers about cohort performance.
You can:
- Click the button and choose from suggested questions or type your own.
- Review AI-generated insights (copy, rate, or regenerate them).
- Clear the chat anytime to start fresh.


Example questions: “Which cohort has the highest repeat rate?” or “What’s the biggest difference between my newer and older cohorts?”
Reading the chart
Matrix view
- Each row = one cohort.
- Each cell = accumulated customer value at a point in time.
- Compare across rows to see how different cohorts perform over time.
Spaghetti chart view
- A visual way to compare cohort performance over time.
- Each line = one cohort’s accumulated value growth.
- Hover over any point for exact values.

Predictive vs. Historical data
The LTV Report can show both historical data (actuals) and predictive data (machine-learning projections):
- Historical data: Solid navy blue cells represent your actual accumulated sales.
- Predictive data: Striped light blue cells extend your cohorts forward in time, showing estimated future value.
This lets you see not only how your customers have performed to date, but also how much they’re likely to spend in the coming months.
Note: Predictive modeling is a powerful feature with its own settings, examples, and best practices.
For a full walkthrough, see Predictive LTV in the Lifetime Value Report.
Tips & key metrics
Best practices
- Compare predictive vs. historical LTV to spot where future value may outpace past trends.
- Look beyond averages: Use Repeat Rate (R-%) to see how many customers return, and Accumulated Value to measure how much they spend.
- Adjust timeframes: Use shorter cohorts to quickly test new strategies, longer ones for steady behavior.
- Monitor CAC vs. value: Watch the CAC payback indicator to ensure your acquisition costs are sustainable.
Quick reference metrics
- CAC (Customer Acquisition Cost): The average marketing spend required to acquire a new customer.
- R-% (Repeat Rate): The percentage of customers in a cohort who placed at least one additional order.
- Accumulated Sales per Customer: Total sales generated by a cohort divided by the number of customers in that cohort, measured over time.
- Predictive LTV: An AI-estimated forecast of the future lifetime value of a cohort, based on current buying behavior.