Back in Stock: Analytics & Reports
Back in Stock provides comprehensive analytics to help you understand customer demand, optimize notification timing, and track performance across all channels. This guide covers everything from basic dashboard metrics to advanced conversion analytics.
In this article, the following sections are discussed:
- Dashboard Overview
- Products Data (BIS/Preorders)
- BIS Signup Data
- BIS Notifications Data
- Preorders Data
- Analytics Page (Advanced Insights)
- Google Analytics Integration
- Frequently Asked Questions
Dashboard Overview

Access: Dashboard Page
Your main dashboard provides a quick snapshot of notification performance and customer demand patterns.
Key Dashboard Elements:
Timeline View
- Visual timeline showing created, sent, and converted notifications by date
- Date Range Filter (A): Click to configure custom ranges or use presets (Last 7 days, 30 days, etc.)
- Daily Details (B): Hover over any date to see created, sent, and converted values for that specific day
Most Wanted Products
- Shows products with the highest notification requests
- Toggle between "Last 90 Days" or "All Time" data
- Displays specific product/variant with most requested notifications
- Use for: Inventory planning and identifying high-demand items
Recent Activity
- Real-time feed of newly created notifications
- Shows customer signups in chronological order (most recent first)
- Use for: Monitoring current customer interest and demand patterns
Products Data

Access: Products Page
Track which products generate the most customer interest and notification requests.
Back in Stock Products Tab (Default)
- Sort options: By SKU, product name, or notification counts
- Search functionality: Find specific products by title or SKU
- Grouping option: "Group by product" shows totals at product level instead of variant level
- Export capability: Download data as CSV for spreadsheet analysis
Preorder Products Tab
Click the "Preorder Products" tab to view equivalent data for preorders. See Preorders Data section below for other Preorder metrics.
Best Practices:
- Review weekly to identify restocking priorities
- Use high notification counts as indicators for inventory investment
- Monitor seasonal trends in product demand
BIS Signup Data

Access: Navigate to Back in stock alerts → Overview
Manage individual customer signups and track their notification status.
Key Features:
Search & Filter Options:
- Search by customer email, name, or product SKU
- Filter by status: "Sent" or "Unsent" notifications
- Date range filtering for specific time periods
- Sort by date, product name, or customer email
Customer Status Understanding:
- "Customer Unsubscribed": Customer opted out of this specific notification
- Cannot be re-subscribed to same notification
- Customer can still create new notification requests from product pages
Export Functionality:
- Click "Export to CSV"
- Wait 1-2 minutes for file preparation (longer for large datasets)
- Download and analyze in Excel, Google Sheets, etc.
BIS Notifications Data

Access: Navigate to Back in stock alerts → Notifications
Track individual notifications sent and monitor their delivery status.
Use Cases:
- Monitor delivery success rates
- Troubleshoot notification delivery issues
- Track notification performance by product or time period
- Identify patterns in failed deliveries
Preorders Data

Access: Navigate to Preorders → Overview Page
Track preorder performance and revenue metrics across all preorder products.
Key Metrics:
Preorder Items Sold
- Total units sold through preorder functionality
- Use for: Measuring preorder program success and demand fulfillment
Order Count
- Number of individual preorder transactions
- Use for: Understanding customer adoption of preorder offerings
Preorder Revenue
- Total revenue generated from preorder sales
- Use for: Tracking financial impact of preorder strategy and forecasting cash flow
Best Practices:
- Monitor preorder conversion rates to optimize product positioning
- Track revenue trends to plan future preorder campaigns
- Use order count data to gauge customer willingness to wait for products
Analytics Page (Advanced Insights)

Access: Navigate to Analytics section
Conversion Funnel Analytics
Conversion Funnel by Channel
- Visual breakdown comparing Email vs. SMS vs. Web Push performance
- Shows notifications sent and conversion rates per channel
- Use for: Optimizing channel mix and focusing on best-performing notification types
Restock Insights
Best Time to Restock
- Analyzes open rates to predict optimal notification timing
- Provides day-of-week and time-of-day recommendations
- Use for: Schedule restocks during peak engagement windows for maximum visibility
Average Wait Time for Restock
- Measures time between customer signup and notification delivery
- Key insight: Shorter wait times correlate with higher conversion rates
- Use for: Optimize inventory management and restock timing
Average Time to Click "Buy Now"
- Tracks time from notification receipt to purchase click
- Use for: Gauge notification urgency and effectiveness of messaging
Product Performance Analytics

Most Wanted Variants
- Product variants with highest signup demand
- Use for: Prioritize restocking decisions based on customer interest
Best Converting Variants
- Variants that generate the most actual sales from notifications
- Use for: Feature high-converting products in marketing campaigns and store positioning
AI Upsell Metrics

Upsell Revenue from Sign-up Form
- Revenue generated from Upsell by AMP integration during signup
- Use for: Track additional revenue captured during Back in Stock signup process
Upsell Units Sold from Sign-up Form
- Volume of upsell products sold through signup form integration
- Use for: Monitor upsell conversion rates and optimize product offerings in forms
8. Google Analytics Integration
Tracking Conversions
To track Back in Stock conversions in Google Analytics:
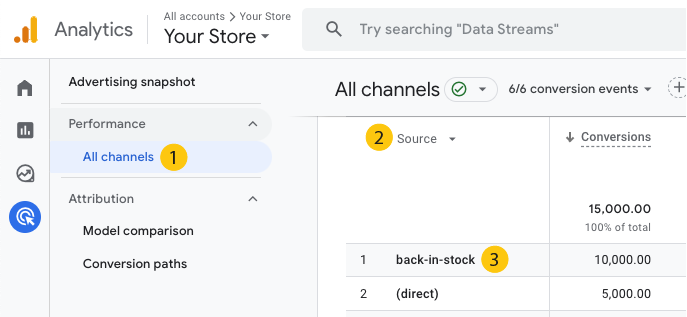
- Ensure proper GA4 setup: Follow Shopify's current GA4 setup documentation
- Verify UTM parameters: Contact backinstock-support@useamp.com to confirm UTM parameters in your email templates
- Monitor attribution: Back in Stock notifications will appear in your GA4 conversion tracking
9. Frequently Asked Questions
Analytics Dashboard
What timezone are metrics based on? All analytics use your main Shopify store timezone setting. To change this, update your Shopify store's timezone (cannot be adjusted within Back in Stock).
Are date ranges inclusive? Yes - selected date ranges include all activity from 12:00:00 AM on the first day through 11:59:59 PM on the last day.
Why isn't conversion value a multiple of product price? Conversion values include the total order value when customers purchase additional items beyond the notified product. If someone receives a notification for a t-shirt but buys the t-shirt plus other items, the entire cart value is attributed to that notification.
What does "Insufficient Data" mean? There isn't enough historical data in your selected timeframe for reliable calculations. Try widening your date range or allowing more time for signups and notifications to accumulate.
How quickly does new data appear? Data updates regularly throughout the day. If recent activity hasn't appeared within an hour, contact support for assistance.
Why are conversions higher than CTA clicks? We attribute conversions through multiple methods beyond just click tracking, including matching Shopify order contact details to notification recipients.
Email Reports
Can activity reports go to multiple emails? Yes - in Settings → Activity updates, enter multiple email addresses separated by commas in the "Deliver to" field.
Need help with analytics setup? Contact backinstock-support@useamp.com