Lifetimely: Understanding Retention vs. Repeat Purchasing
At a glance: Understand the difference between retention rate and repeat purchase rate and when to use each metric.
📈 Understanding Retention vs. Repeat Purchasing in Lifetimely
When evaluating customer lifecycle performance, two of the most important concepts are Retention and Repeat Purchases - and while related, they answer very different questions about customer loyalty and value creation.
This guide explains:
✔️ The key differences
✔️ Where to view each in Lifetimely
✔️ How to use both together for deeper insight
✔️ Example interpretations
🔍 Key Difference (TL;DR)
| Concept | What it measures | Core question answered | Type | Best metric view in Lifetimely |
|---|---|---|---|---|
| Retention | % of customers who come back | “Who came back?” | Customer-level | Cohorts → Customers % |
| Repeat Purchasing | How many times retained customers reorder | “How often did they return?” | Order-level | Cohorts → Customers who purchased X times |
📌 Why this matters
These metrics are NOT interchangeable and each reveals different growth strategies.
You may see:
| Scenario | What it means | Strategy implication |
|---|---|---|
| High retention, low repeat | Many customers return, but only once | Introduce subscriptions, bundles, reorder reminders |
| Low retention, high repeat | Few return, but those who do buy a lot | Improve early experience, onboarding, first-product fit |
Both views together give you a full story of loyalty & LTV.
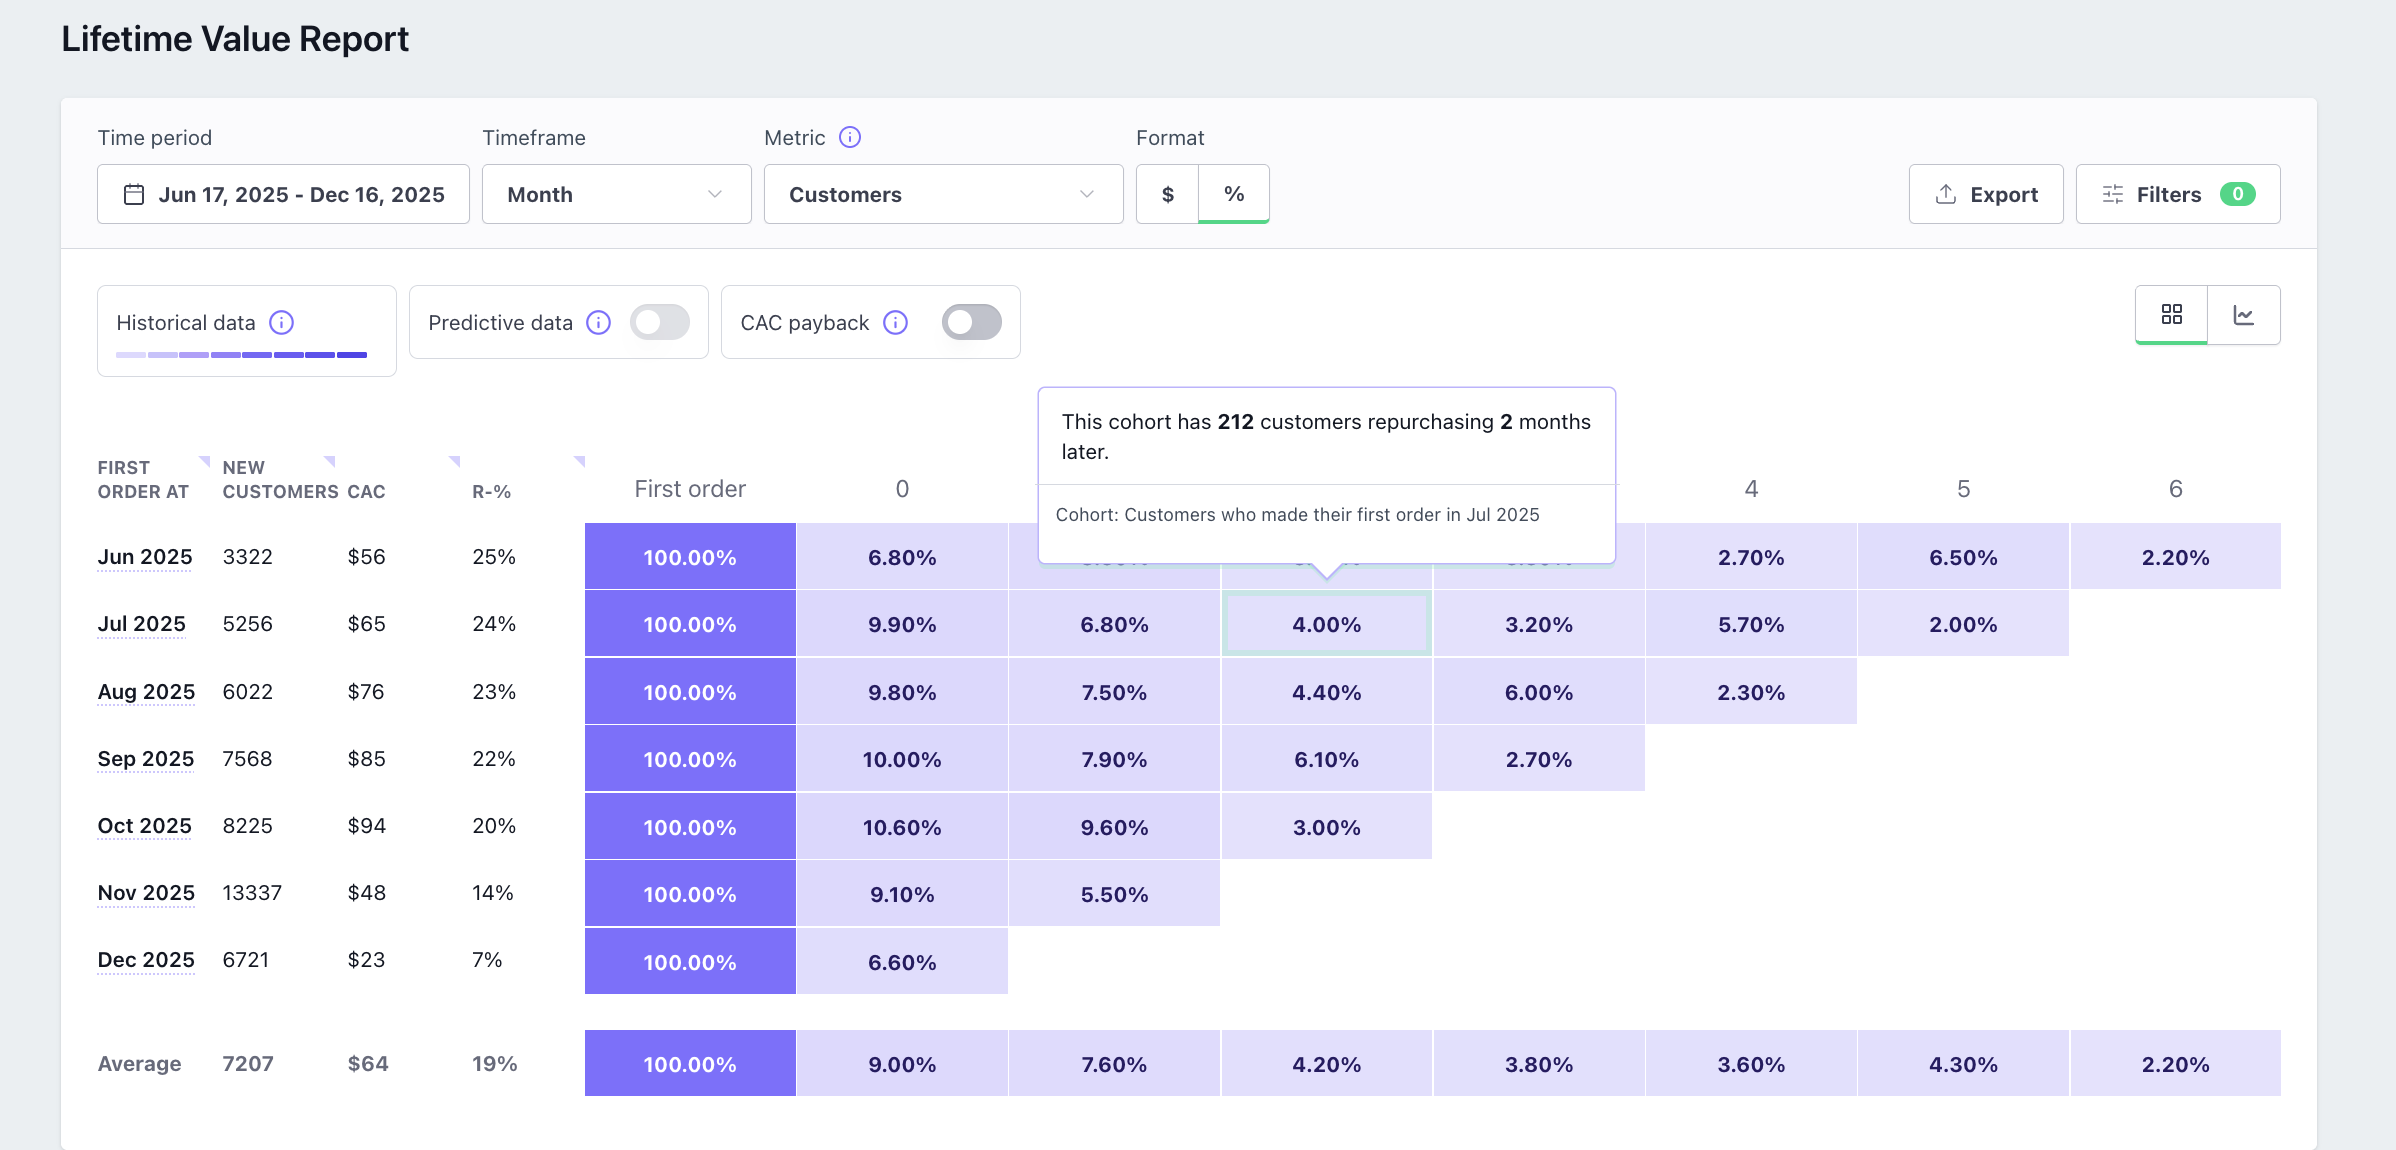
🧠 How Lifetimely Measures Retention
Go to Lifetime Value Report → Metric: Customers → Format: %
This shows what % of the original cohort returns in each period after their first order.
Interpretation example:
4.0% in Month 2 means:
4% of the customers acquired that month came back and purchased again in Month 2.
📌 Ideal when you want to:
- Track returning customers over time
- Benchmark retention by cohort
- Evaluate CAC payback windows
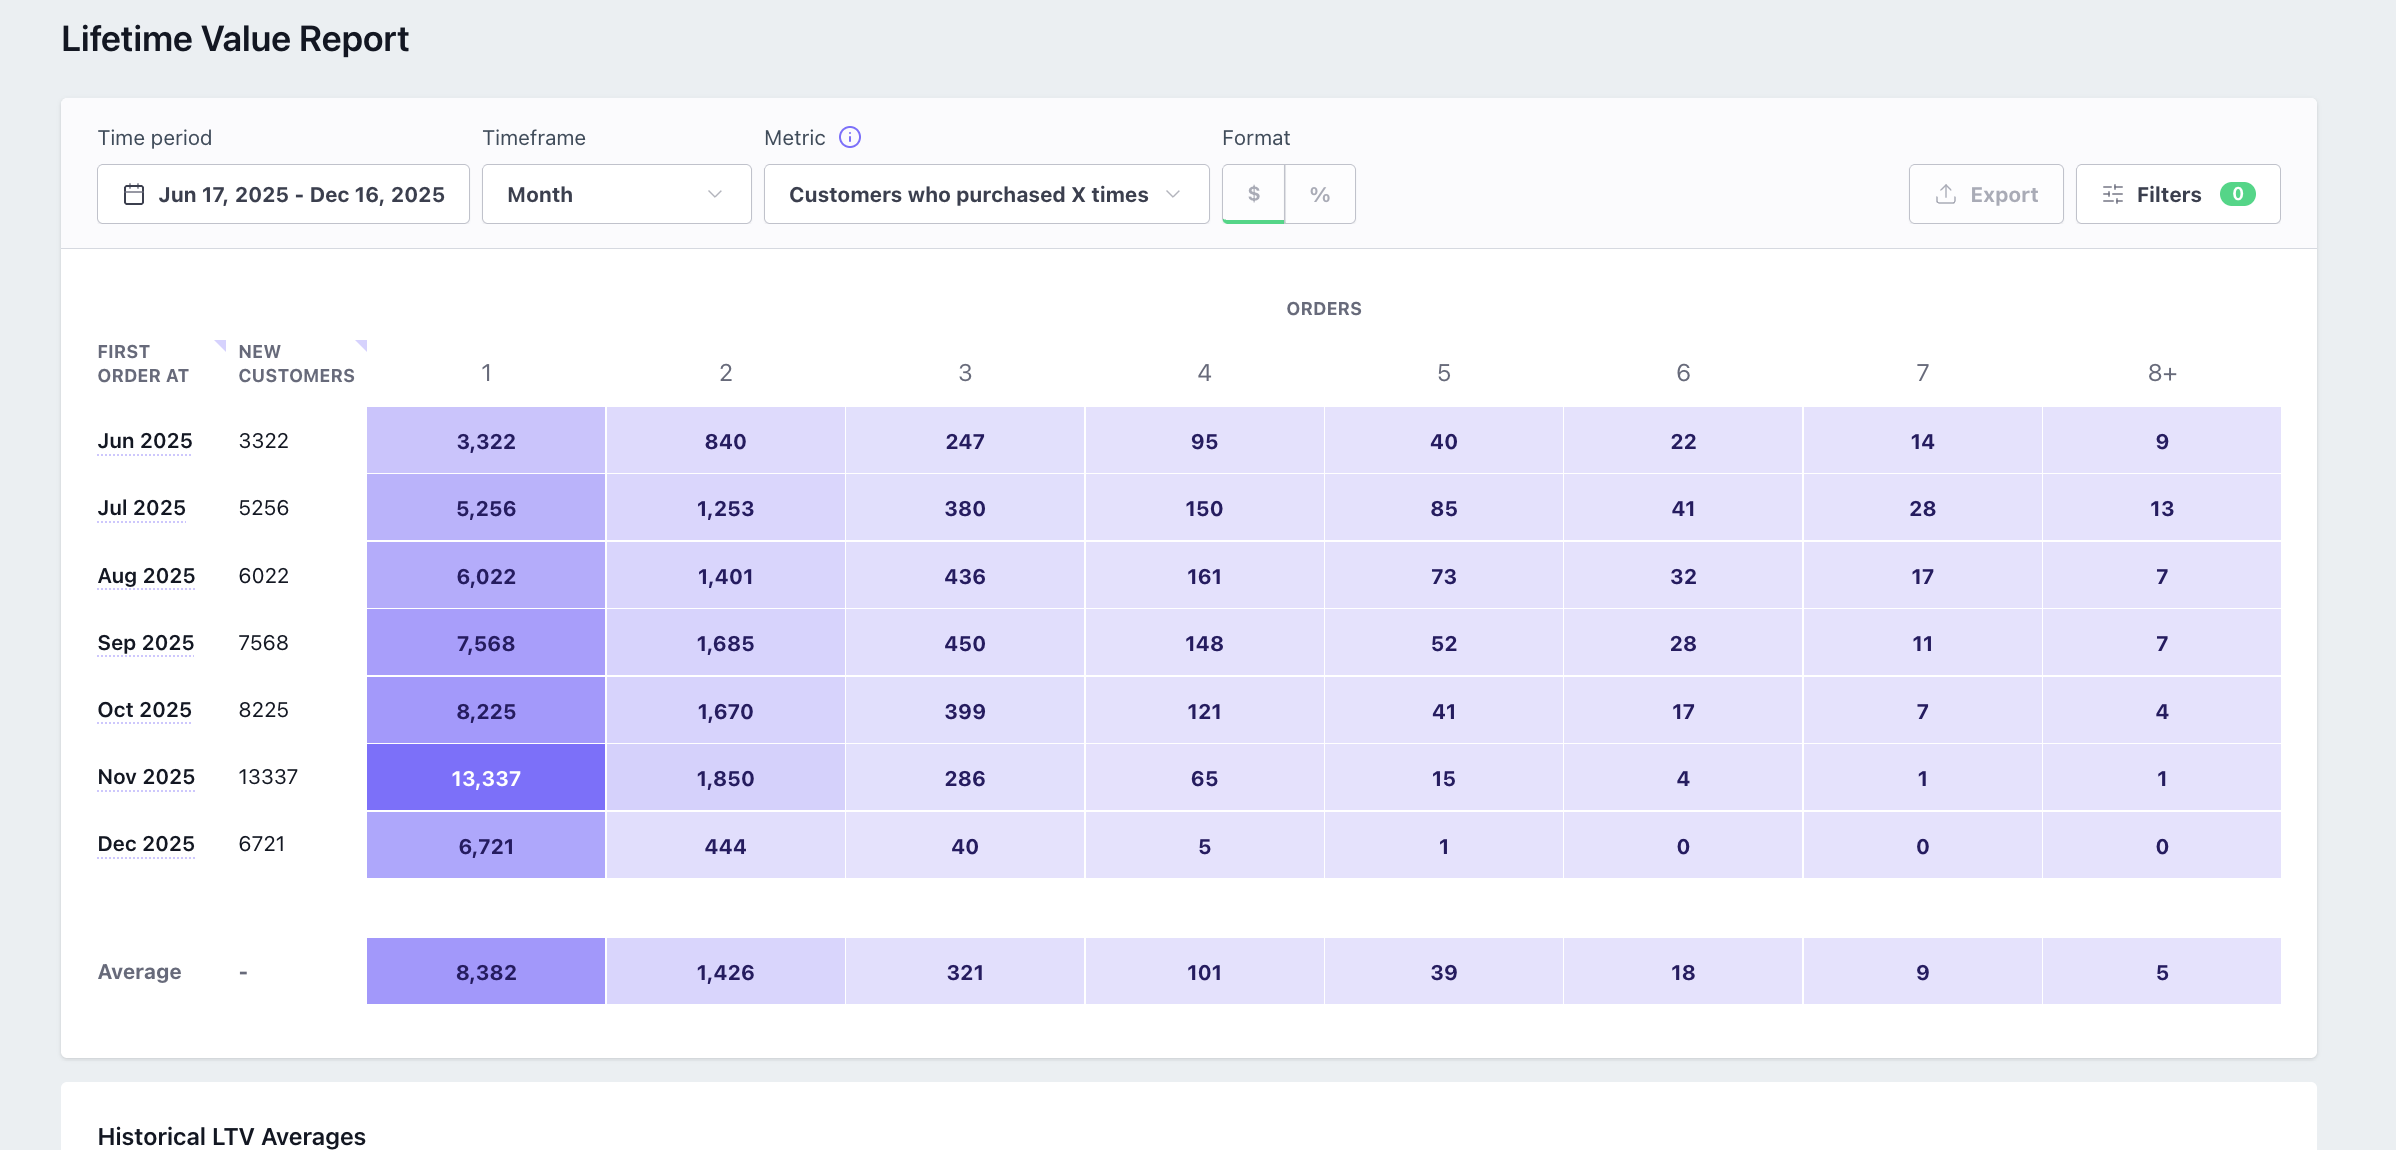
🛒 How Lifetimely Measures Repeat Purchasing
Go to:
Metric: Customers who purchased X times → Format: $ or #
This tells you how many customers reached:
- 2nd order
- 3rd order
- 4th order… up to 8+ orders
📌 Ideal when you want to:
- Understand depth of loyalty
- Identify superusers and whales
- Model LTV tiers and long-term value
🧩 Putting Both Together: The Full Loyalty Picture
Retention tells you how many customers keep coming back.
Repeat purchasing tells you how far they go.
Together, you can diagnose:
- Is the first repeat the hurdle?
- Do customers get “stuck” after 2nd order?
- Is there a small but powerful VIP segment?
📌 Quick Spotlight Examples
| Metric tells you | Example question answered |
|---|---|
| Customers % (Retention) | “How many June customers came back in Month 3?” |
| Customers who purchased X times | “Of June customers, how many reached 3+ orders?” |
| Cohort Transactions % | “How frequently are active customers ordering?” |
❤️ Why Customers Love This Insight
This is one of the simplest ways for growing brands to answer:
“Is our customer base truly loyal — or simply returning once?”
…and turn that into action:
- Remarketing & replenishment automation
- Product-specific retention strategies
- CAC & payback window optimization
- VIP & rewards segmentation
- Improved merchandising for 2nd/3rd purchase push
🙋 FAQs
Where can I see this for Net Sales instead of Customers?
Use the Cohort net sales metric for revenue-based cohort views.
Can I export the data?
Yes - use the Export button in the top-right corner of the LTV report.
Does this match Shopify’s retention report?
Our customer-level % retention aligns directionally with Shopify - but Lifetimely offers:
- Full filtering capabilities
- More repeat purchase views
- Cohort-specific CAC + financial impact
📬 Still have questions?
Our team is happy to walk through your data or recommend which retention goals matter most for your business.
Just reach out via in-app chat!