Lifetimely: Attribution Overview Report Breakdown
At a glance: Compare Shopify sales data against ad platform metrics across Google, Facebook, and TikTok in one report.
Analyze cross-platform sales and ad performance with flexible attribution models
The Attribution Overview Report combines Shopify sales data with ad platform metrics (Google, Facebook, TikTok) to give you a complete view of your revenue and spend. You can switch between platform attribution and Shopify attribution and customize time periods and models for deeper insights.

Key Features
- View blended and per-platform performance across ad channels
- Toggle between platform attribution and Shopify attribution
- Compare performance across custom time ranges and previous periods
- Analyze metrics like Attributed Revenue, Spend, CPC, and ROAS
- Switch between First Touch and Last Touch attribution models
- Dynamically filter platforms (Google, Facebook, TikTok) in charts
Selecting and Comparing Time Periods
Use the date selector to set your analysis window (e.g., last 7 days, last month, last year). The report automatically groups data by day, week, month, or year based on the selected range.
-
Longer ranges (e.g., last year) default to monthly grouping for readability
Add comparison periods to track trends, such as:
- Previous period
- Previous period (day-of-week aligned)
- Same period last year

Fixed Metrics
At the top of the report, you’ll see Revenue and Orders from Shopify:
- Revenue – Total sales less discounts and refunds from Shopify
- Orders – Total count of Shopify orders
These metrics are not adjustable via attribution settings. They serve as a baseline for all subsequent attributed metrics.

Adjusting Data Settings
These controls define how data is sourced and attributed.
Data Sources
- Revenue and Orders – Shopify orders
- Spend and Attributed Revenue – Ad platforms (Google, Facebook, TikTok)
- Sessions & Conversion Rates – Currently visible but being phased out (not recommended for use)
Attribution Mode
- Platform Data Mode (default) – Revenue + spend from ad platforms
- Shopify Data Mode – Revenue from Shopify visits; spend remains from ad platforms
- Switching modes recalculates CPC and ROAS
Attribution Model
- For Shopify data, you can choose between First Touch or Last Touch to see revenue shifts between models. For Platform Data, revenue is shown using the platform’s default attribution.

Platform Breakdown & Key Metrics
At the bottom, you’ll see blended totals (all platforms) and per-platform metrics (Google, Facebook, TikTok).
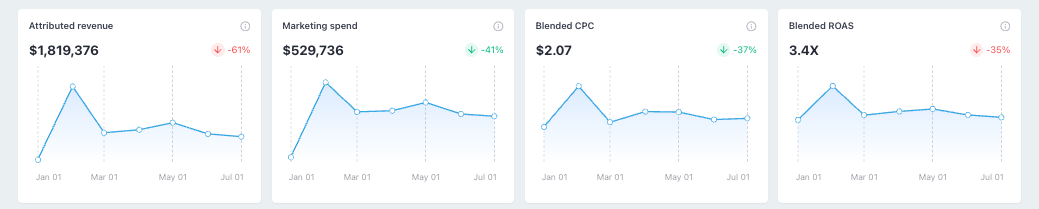
Blended Metrics (All Platforms)
- Attributed Revenue – Conversion revenue for all campaigns
- Marketing Spend – Total spend for all campaigns
- Blended CPC – Total Spend ÷ Total Conversions
-
Blended ROAS – Total Revenue ÷ Total Spend

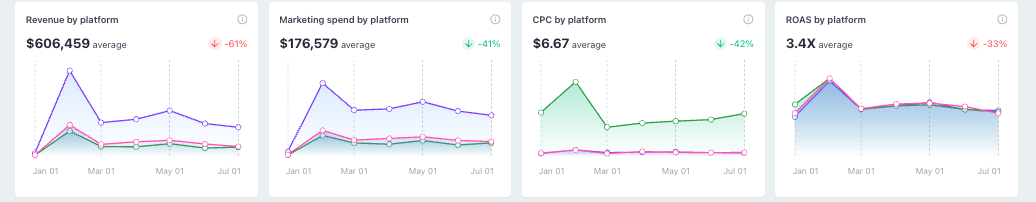
Per-Platform Metrics
- Revenue by Platform – Conversion revenue per platform
- Marketing Spend by Platform – Spend per platform
- CPC by Platform – Platform Spend ÷ Platform Conversions
-
ROAS by Platform – Platform Revenue ÷ Platform Spend

Tips for Using the Report
- Use toggles for clarity: Isolate platform-specific performance
- Compare models: First vs. last touch highlights early vs. late funnel insights
Key Metric Glossary
Attributed Revenue – Conversion revenue reported by ad platforms
Marketing Spend – Total spend reported by ad platforms
CPC – Spend ÷ Conversions (blended or per platform)
ROAS – Revenue ÷ Spend (blended or per platform)
You’re All Set!
The Attribution Overview Report helps you:
- Understand cross-platform performance
- Toggle data sources and attribution models for flexible insights
-
Make smarter budget and optimization decisions
Need more help? Chat with us in-app or visit our Help Center.